How to Build Resilient Observability Pipelines with OpenTelemetry and Kafka!
Prevent log and metric loss using local buffering and decoupled ingestion
Ever woke up to a Slack message saying “we lost 2 hours of logs during the incident last night”? Yeah, me too. And it’s the worst feeling because that’s exactly when you needed those logs the most.
The Problem We Kept Running Into#
Our observability setup was working great, until it wasn’t. Here’s what kept biting us:
Scenario 1: The Ingestor or Distributor Pod Crash We had proper HPA strategies in place, scaling on both CPU and memory. The autoscaling worked fine under normal conditions. But log storage backends have a way of surprising you.
In environments running Loki, sometimes an ingester’s WAL disk would fill up unexpectedly, causing it to hit memory limits and crash. Other times, a sudden burst of logs would OOM the distributor before HPA could react.
We saw similar issues with VictoriaLogs in other environments, sudden spikes overwhelming the ingestion endpoint. During those 2–3 minutes of pod restart or recovery, every log line from our agents vanished into the void. Gone. Forever. Autoscaling doesn’t help when the crash happens faster than the scale-up.
Scenario 2: Network Instability Across Regions and Zones Running workloads across multiple availability zones or regions, whether it’s Docker hosts on VMs or Kubernetes clusters, means network reliability is never guaranteed. Cross-AZ latency spikes, cloud provider network partitions, CNI plugin failures in Kubernetes, or load balancer health check flapping would all cause intermittent connectivity. Agents would buffer data in memory, hit their limits, and start dropping telemetry.
The irony? We’d lose the very logs and metrics that could help us debug the network issues.
Scenario 3: Planned Maintenance and Rolling Updates Upgrading VictoriaMetrics, applying security patches to VictoriaLogs, or even routine Kubernetes node upgrades meant brief periods where ingestion endpoints were unavailable.
In Docker environments, redeploying the stack would cause momentary gaps. In Kubernetes, rolling updates, pod evictions during node drains, or PDB misconfigurations would leave us without a healthy endpoint for seconds to minutes. Brief for us, but that’s thousands of data points we’d never get back, often during the exact maintenance window we’d want to monitor closely.
The root cause was simple: we had a direct pipe from agents to storage. If any part of that pipe broke, data fell on the floor.
The Solution: Adding a Shock Absorber#
The fix? Put something durable in the middle. Something that could hold onto data when downstream systems were having a bad day.
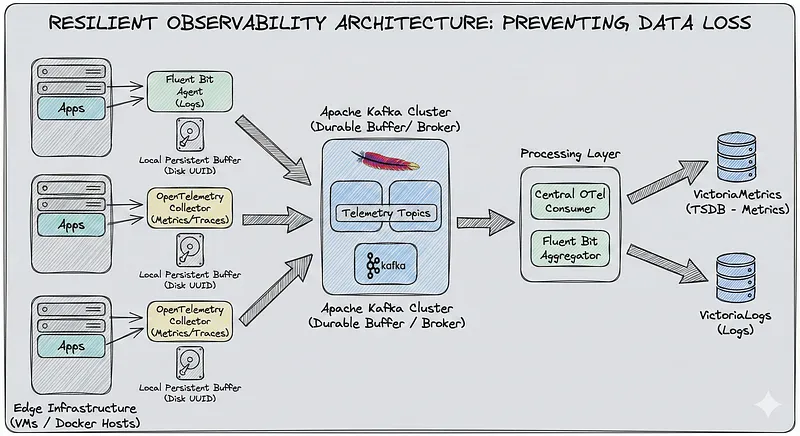
That something is Kafka, combined with local persistent buffers on every agent. Here’s the architecture we landed on:
Edge Infrastructure               Message Broker              Processing Layer
┌─────────────────┐             ┌─────────────┐            ┌──────────────────┐
│  Fluent Bit     │─────────────│             │            │  Fluent Bit      │───▶ VictoriaLogs
│  Agent (Logs)   │   Kafka     │   Kafka     │            │  Aggregator      │
│  + Local Buffer │────Topics───│   Cluster   │────────────│                  │
│                 │             │   (KRaft)   │            │  OTel Consumer   │───▶ VictoriaMetrics
│  OTel Collector │─────────────│             │            │  Agent           │
│  (Metrics)      │             └─────────────┘            └──────────────────┘
│  + Local Buffer │
└─────────────────┘
Two layers of protection:
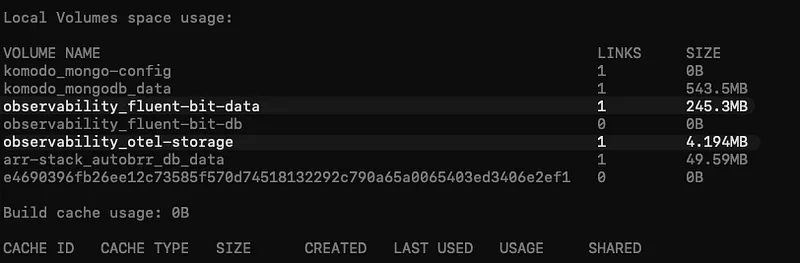
- Local disk buffer on agents: If Kafka is unreachable, agents write to local disk instead of dropping data
- Kafka as durable buffer: If VictoriaLogs/VictoriaMetrics is down, data sits safely in Kafka until they’re back
Let’s break down each component.
Part 1: Fluent Bit Agent Configuration#
Fluent Bit is our log collection workhorse. The key to making it resilient is enabling filesystem-based buffering. Here’s the configuration:
[SERVICE]
    Flush        5
    Daemon       Off
    Log_Level    info
    Parsers_File parsers.conf
    HTTP_Server  On
    HTTP_Listen  0.0.0.0
    HTTP_Port    2023

    # Filesystem storage for backpressure handling
    storage.metrics           On
    storage.path              /fluent-bit/data/storage
    storage.sync              normal
    storage.checksum          off
    storage.backlog.mem_limit 5M
    storage.delete_irrecoverable_chunks On

    ...

# Docker container logs
[INPUT]
    Name              tail
    Path              /var/lib/docker/containers/*/*.log
    Parser            docker
    Tag               local.docker
    Path_Key          filepath
    multiline.parser  docker, java, python, go
    DB                /fluent-bit/data/flb_local_docker.db
    DB.locking        true
    Refresh_Interval  30
    Rotate_Wait       30
    storage.type      filesystem    # <-- Key setting
    Skip_Empty_Lines  On
    Ignore_Older      24h
    Buffer_Chunk_Size 64KB
    Buffer_Max_Size   128KB
    Read_from_Head    False
    Inotify_Watcher   True
    Mem_Buf_Limit     1MB

...

[OUTPUT]
    Name        kafka
    Match       local.*
    Brokers     ${KAFKA_BROKER_1},${KAFKA_BROKER_2},${KAFKA_BROKER_3}
    Topics      fluent-bit-logs-v1
    Format      json

    Timestamp_Key    @timestamp
    Timestamp_Format iso8601

    # Kafka producer settings tuned for reliability
    rdkafka.client.id                       ${HOST_NAME}-fluent-bit
    rdkafka.request.required.acks           -1        # Wait for all replicas
    rdkafka.compression.codec               snappy    # Good balance of speed/size
    rdkafka.log.connection.close            false
    rdkafka.queue.buffering.max.messages    100
    rdkafka.queue.buffering.max.kbytes      128
    rdkafka.queue.buffering.max.ms          500
    rdkafka.batch.num.messages              100
    rdkafka.message.send.max.retries        3
    rdkafka.retry.backoff.ms                100
    rdkafka.socket.keepalive.enable         true

    # This is critical - how much to buffer locally if Kafka is down
    storage.total_limit_size                5G
    Retry_Limit                             False     # Never give up
The storage.path setting is crucial. When output destinations become unavailable, Fluent Bit writes chunks to this directory instead of holding everything in memory (and eventually dropping data).
Each input source gets its own database file for tracking position, and storage.type filesystem for buffering.
Part 2: OpenTelemetry Collector for Metrics#
For metrics, we use the OpenTelemetry Collector. It’s more flexible than Prometheus for our use case, and has excellent support for buffering and retries.
In OTel we use the file_storage extension which provides persistent queue storage. When Kafka is unavailable, data gets written to disk instead of being dropped.
receivers:
  ...

processors:
  ...

extensions:
  file_storage:
    directory: /var/lib/otelcol/file_storage
    timeout: 10s
    create_directory: true
    compaction:
      directory: /var/lib/otelcol/file_storage
      on_start: true
      on_rebound: true
      rebound_needed_threshold_mib: 100
      rebound_trigger_threshold_mib: 10

exporters:
  kafka/metrics:
    brokers:
      - ${KAFKA_BROKER_1}
      - ${KAFKA_BROKER_2}
      - ${KAFKA_BROKER_3}
    protocol_version: 3.9.0
    topic: otel-metrics-v1
    encoding: otlp_proto
    producer:
      max_message_bytes: 10485760
      required_acks: -1           # All replicas must acknowledge
      compression: snappy
    timeout: 30s

    # Retry forever with exponential backoff
    retry_on_failure:
      enabled: true
      initial_interval: 5s
      randomization_factor: 0.5
      multiplier: 1.5
      max_interval: 60s
      max_elapsed_time: 0         # 0 = retry forever

    # Persistent sending queue backed by file_storage
    sending_queue:
      enabled: true
      num_consumers: 4
      queue_size: 10000
      storage: file_storage       # <-- This links to the extension

service:
  ...
  extensions: [health_check, pprof, zpages, file_storage]
The sending_queue.storage: file_storage setting is the key. It tells OTel to use our file_storage extension for the queue, making it survive restarts. Combined with max_elapsed_time: 0, the collector will retry forever until Kafka is back.
Part 3: Kafka - The Durable Buffer#
Kafka sits in the middle as our shock absorber. We run it in KRaft mode (no ZooKeeper dependency), which simplifies operations significantly.
Why Kafka Instead of Direct Push?#
Three big reasons:
- Decoupled Ingestion from Processing: High-cardinality spikes from agents don’t directly hit VictoriaMetrics. Kafka absorbs the burst, and consumers pull at their own pace.
- Durability: Data is replicated across Kafka brokers. Even if a broker dies, data isn’t lost.
- Replay Capability: Need to reprocess logs through a new pipeline? Just reset the consumer offset and replay from Kafka.
Topic Configuration#
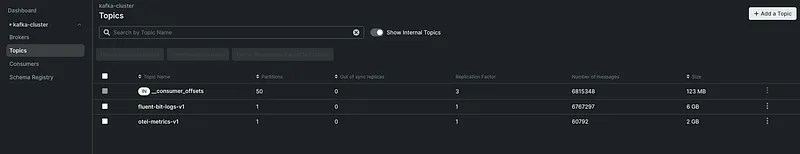
For logs:
Topic: fluent-bit-logs-v1ya
Partitions: 6 (one per source server works well)
Replication Factor: 3
Retention: 72 hours
For metrics:
Topic: otel-metrics-v1
Partitions: 6
Replication Factor: 3
Retention: 24 hours (metrics are smaller, shorter retention is fine)
Handling High Cardinality#
Here’s a scenario we hit: during deployments, our metric cardinality would spike 10x. Previously, this would overwhelm VictoriaMetrics ingesters and cause drops.
With Kafka in the middle:
- Agents push to Kafka at whatever rate they need (Kafka handles it)
- Consumer pulls from Kafka at a controlled rate
- If consumer falls behind, data accumulates in Kafka (not in agent memory)
- VictoriaMetrics stays happy with consistent ingestion rate
Fluent Bit Consumer (Logs → VictoriaLogs)#
The consumer pulls logs from Kafka and pushes to VictoriaLogs. Notice how we lift the nested payload and preserve the original labels:
[SERVICE]
    Flush        5
    Daemon       Off
    Log_Level    info
    HTTP_Server  On
    HTTP_Listen  0.0.0.0
    HTTP_Port    2024
    storage.metrics  On
    Parsers_File /fluent-bit/etc/parsers.conf

[INPUT]
    Name              kafka
    Brokers           kafka1:9092,kafka2:9092,kafka3:9092
    Topics            fluent-bit-logs-v1
    Group_Id          fluent-bit-logs-consumer
    Poll_Ms           100
    Buffer_Max_Size   2M
    Format            json
    rdkafka.enable.auto.commit        true
    rdkafka.auto.commit.interval.ms   5000
    rdkafka.session.timeout.ms        30000
    rdkafka.heartbeat.interval.ms     3000

# Lift all fields from payload.* to root level
# Kafka INPUT with Format=json nests data under 'payload'
[FILTER]
    Name         nest
    Match        *
    Operation    lift
    Nested_under payload

# Remove Kafka metadata fields we don't need in storage
[FILTER]
    Name         record_modifier
    Match        *
    Remove_key   topic
    Remove_key   partition
    Remove_key   offset
    Remove_key   key
    ...

# Add consumer tracking
[FILTER]
    Name         record_modifier
    Match        *
    Record       consumer_name  fluent-bit-kafka-consumer
    Record       pipeline       kafka-to-victorialogs

[OUTPUT]
    Name        http
    Match       *
    Host        ${VICTORIALOGS_HOST}
    Port        443
    URI         /insert/jsonline?_stream_fields=stream,service_name,service_namespace,host_name,env,site_name&_msg_field=log&_time_field=@timestamp
    Format      json_lines
    Json_date_key    @timestamp
    Json_date_format iso8601
    tls         On
    tls.verify  Off
    Retry_Limit 3
    net.keepalive            On
    net.keepalive_idle_timeout 30
The _stream_fields parameter in the VictoriaLogs URI is important-it tells VictoriaLogs which fields to use for stream identification. This preserves our label structure from the agents.
OTel Consumer (Metrics → VictoriaMetrics)#
For metrics, the OTel consumer pulls from Kafka and writes to VictoriaMetrics using Prometheus remote write:
receivers:
  kafka/metrics:
    brokers:
      - kafka1:9092
      - kafka2:9092
      - kafka3:9092
    protocol_version: 3.9.0
    topic: otel-metrics-v1
    encoding: otlp_proto
    group_id: otel-metrics-consumer
    initial_offset: latest
    session_timeout: 30s
    heartbeat_interval: 3s

processors:
  batch:
    send_batch_size: 10000
    send_batch_max_size: 11000
    timeout: 10s

  memory_limiter:
    check_interval: 10s
    limit_percentage: 75
    spike_limit_percentage: 50

  # Ensure critical attributes from agents are preserved
  attributes/preserve:
    actions:
      - key: site_name
        action: upsert
        from_attribute: site_name
      - key: host_name
        action: upsert
        from_attribute: host_name
      - key: env
        action: upsert
        from_attribute: env
      - key: service_name
        action: upsert
        from_attribute: service_name
      - key: job
        action: upsert
        from_attribute: job
      ...

  # Transform to ensure service.name format
  transform/labels:
    metric_statements:
      - context: datapoint
        statements:
          - set(attributes["service.name"], attributes["service_name"]) where attributes["service_name"] != nil
          - set(attributes["service.namespace"], attributes["service_namespace"]) where attributes["service_namespace"] != nil

exporters:
  prometheusremotewrite:
    endpoint: https://${VICTORIAMETRICS_HOST}/api/v1/write
    timeout: 30s
    resource_to_telemetry_conversion:
      enabled: true           # <-- Critical: sends resource attrs as labels
    retry_on_failure:
      enabled: true
      initial_interval: 5s
      max_interval: 30s
      max_elapsed_time: 300s

service:
  extensions: [health_check, pprof, zpages]
  pipelines:
    metrics:
      receivers: [kafka/metrics]
      processors: [memory_limiter, batch, attributes/preserve, transform/labels]
      exporters: [prometheusremotewrite]
The key setting here is resource_to_telemetry_conversion: enabled: true. This ensures all the resource attributes we set on the agent side (like site_name, host_name, env) get converted to metric labels in VictoriaMetrics. Without this, you’d lose all your carefully crafted labels.
Part 4: Storage Backends#
VictoriaMetrics for Metrics#
We chose VictoriaMetrics over Prometheus for several reasons:
- Better compression (10x less disk usage)
- Built-in clustering support
- Handles high cardinality gracefully
- Drop-in Prometheus compatibility
The consumer OTel agent writes to VictoriaMetrics using the Prometheus remote write protocol.
VictoriaLogs (or Loki) for Logs#
Depending on the environment, we use either VictoriaLogs or Loki for log storage.
VictoriaLogs is our preferred choice for newer deployments:
- Simpler architecture (no separate ingesters/distributors)
- Better performance for our log volumes
- LogsQL is intuitive if you know PromQL
Loki runs in some of our existing environments:
- Already battle-tested in production
- Good Grafana integration
- Distributed mode with ingesters and distributors
The beauty of this architecture? The backend doesn’t matter. Kafka sits in the middle, so we can swap VictoriaLogs for Loki (or vice versa) without touching the agents. The Fluent Bit aggregator (consumer) writes to whichever backend is configured for that environment.
Part 5: Putting It All Together#
The Complete Data Flow
Logs:
Container/System Logs
    → Fluent Bit Agent (with filesystem buffer)
    → Kafka (fluent-bit-logs-v1 topic)
    → Fluent Bit Aggregator
    → VictoriaLogs
Metrics:
Host/Container/App Metrics
    → OTel Collector (with file_storage queue)
    → Kafka (otel-metrics-v1 topic)
    → OTel Consumer
    → VictoriaMetrics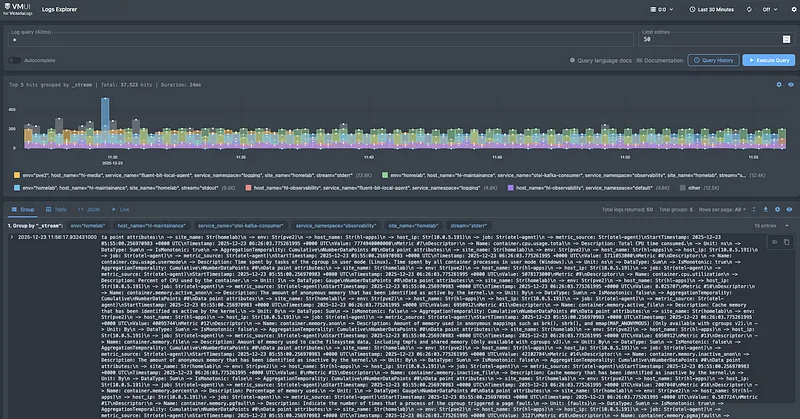
Monitoring the Pipeline Itself#
Don’t forget to monitor your monitoring. Key metrics to watch:
Fluent Bit:#
- fluentbit_input_records_total - Are we collecting logs?
- fluentbit_output_retries_total - Are we having delivery issues?
- fluentbit_storage_chunks - How much is buffered locally?
OTel Collector:#
- otelcol_exporter_queue_size - Queue depth
- otelcol_exporter_send_failed_metric_points - Failed sends
- otelcol_processor_batch_timeout_trigger_send - Batch behavior
Kafka:#
- Consumer lag per topic/partition - Is the consumer keeping up?
- Under-replicated partitions - Broker health
- Request latency - Overall cluster health
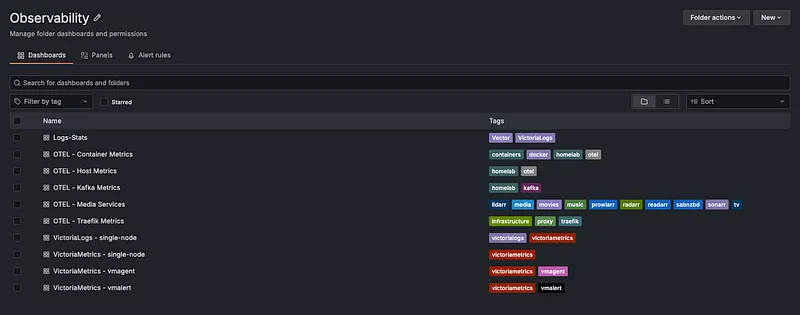
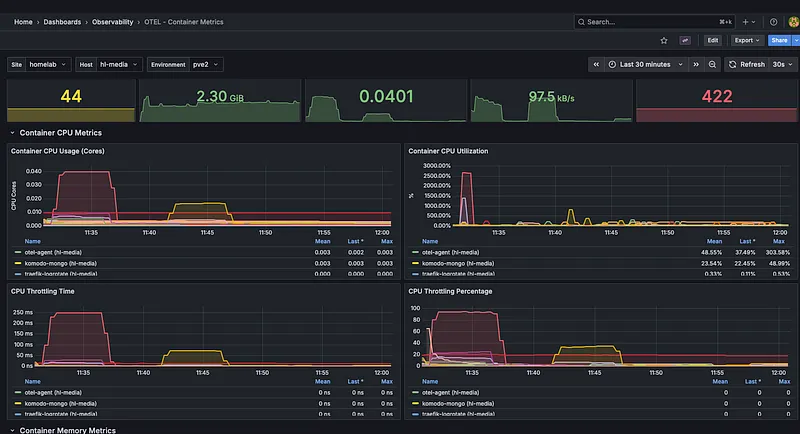
I’m currently working on a set of Grafana dashboards specifically for monitoring this pipeline, covering Fluent Bit agents, OTel collectors, Kafka consumer lag, and end-to-end data flow health. Will release them once they’re polished. Stay tuned!
Lessons Learned#
- After running this setup for several months:
- Size your local buffers appropriately. We started with 1GB and hit limits during a 5-minute Kafka maintenance. 100GB gives us comfortable headroom.
- Kafka retention matters. 72 hours for logs lets us handle weekend incidents without losing data, even if the consumer is down.
- Monitor consumer lag religiously. It’s your early warning system. Growing lag means something downstream is struggling.
- Test your failure scenarios. Actually kill Kafka, kill VictoriaMetrics, disconnect the network. Verify data isn’t lost.
- Label everything at the source. Adding site_name, env, host_name at the agent level means you can always trace where data came from.
Wrapping Up#
- Building resilient observability isn’t about preventing failures, failures will happen. It’s about designing systems that don’t lose data when they do.
- The combination of local persistent buffers (filesystem storage in Fluent Bit, file_storage in OTel) and Kafka as a durable message broker gives us two layers of protection. We’ve gone from regularly losing data during incidents to zero data loss over the past several months.
- The configs in this post are production-tested. Copy them, adapt them to your environment, and stop losing observability data when you need it most.